The Honorable Michael Faulkender
August 22, 2024
Research Report
|
America First Policy Institute
Pro-Growth Tax Reform Works: Evidence from the 2017 Tax Cuts and Jobs Act
Key Takeaways
America is fast approaching a tax cliff at the end of 2025 with the expiration of major provisions of the 2017 Tax Cuts and Jobs Act (TCJA), which, if allowed to occur, would lead to less investment, smaller paychecks, and slower growth.
TCJA helped usher in the historic pre-COVID economic prosperity that saw income gains reach record highs and poverty rates reach record lows while keeping inflation low and stable.
The latest academic research provides even more rigorous support for the positive effects of TCJA by finding that it led firms to increase domestic investment significantly and raise domestic labor compensation.
Introduction
Given the all-too-regular cadence of manufactured emergencies and fiscal cliff episodes that emanate from Washington, D.C., Americans may be inclined to shrug off talk of a tax cliff in 2025. But the impending expiration of many major provisions from the 2017 Tax Cuts and Jobs Act (TCJA) poses a real and serious threat to the health of the economy and financial well-being of America’s families, workers, and businesses. Americans have long instinctively known that the unprecedented prosperity they experienced in the years after the passage of TCJA and before the disruption of COVID-19 was no mere coincidence—it was a result of good policy driven by America First leadership. Now, recent academic research solidifies this intuition by confirming that, yes—despite what the critics say—TCJA has worked as promised, and pro-growth tax reform still matters. This evidence strengthens the already robust case for extending TCJA and sparing Americans from what would otherwise be a historic tax increase inflicted at a time when people are reeling from the reverberations of historic inflation caused by reckless spending and burdensome regulation.
In brief, the latest evidence demonstrates that the corporate tax reforms alone boosted economic growth, producing a 20 percent increase in domestic investment. The research estimates that the long-run domestic capital stock will grow by 7 percent, resulting in increased pre-tax wages on top of the direct boost to take-home pay from the tax cuts for individuals. And this analysis does not even take into account the other pro-growth elements of TCJA, like the 20 percent pass-through deduction for small businesses. Allowing TCJA provisions to expire would hurt families twice over by directly increasing their personal tax bill and causing their wages to fall—a family of four earning $60,000 could face a drop in their take-home pay of more than $3,200.
TCJA Background, Pillars, and Foundations
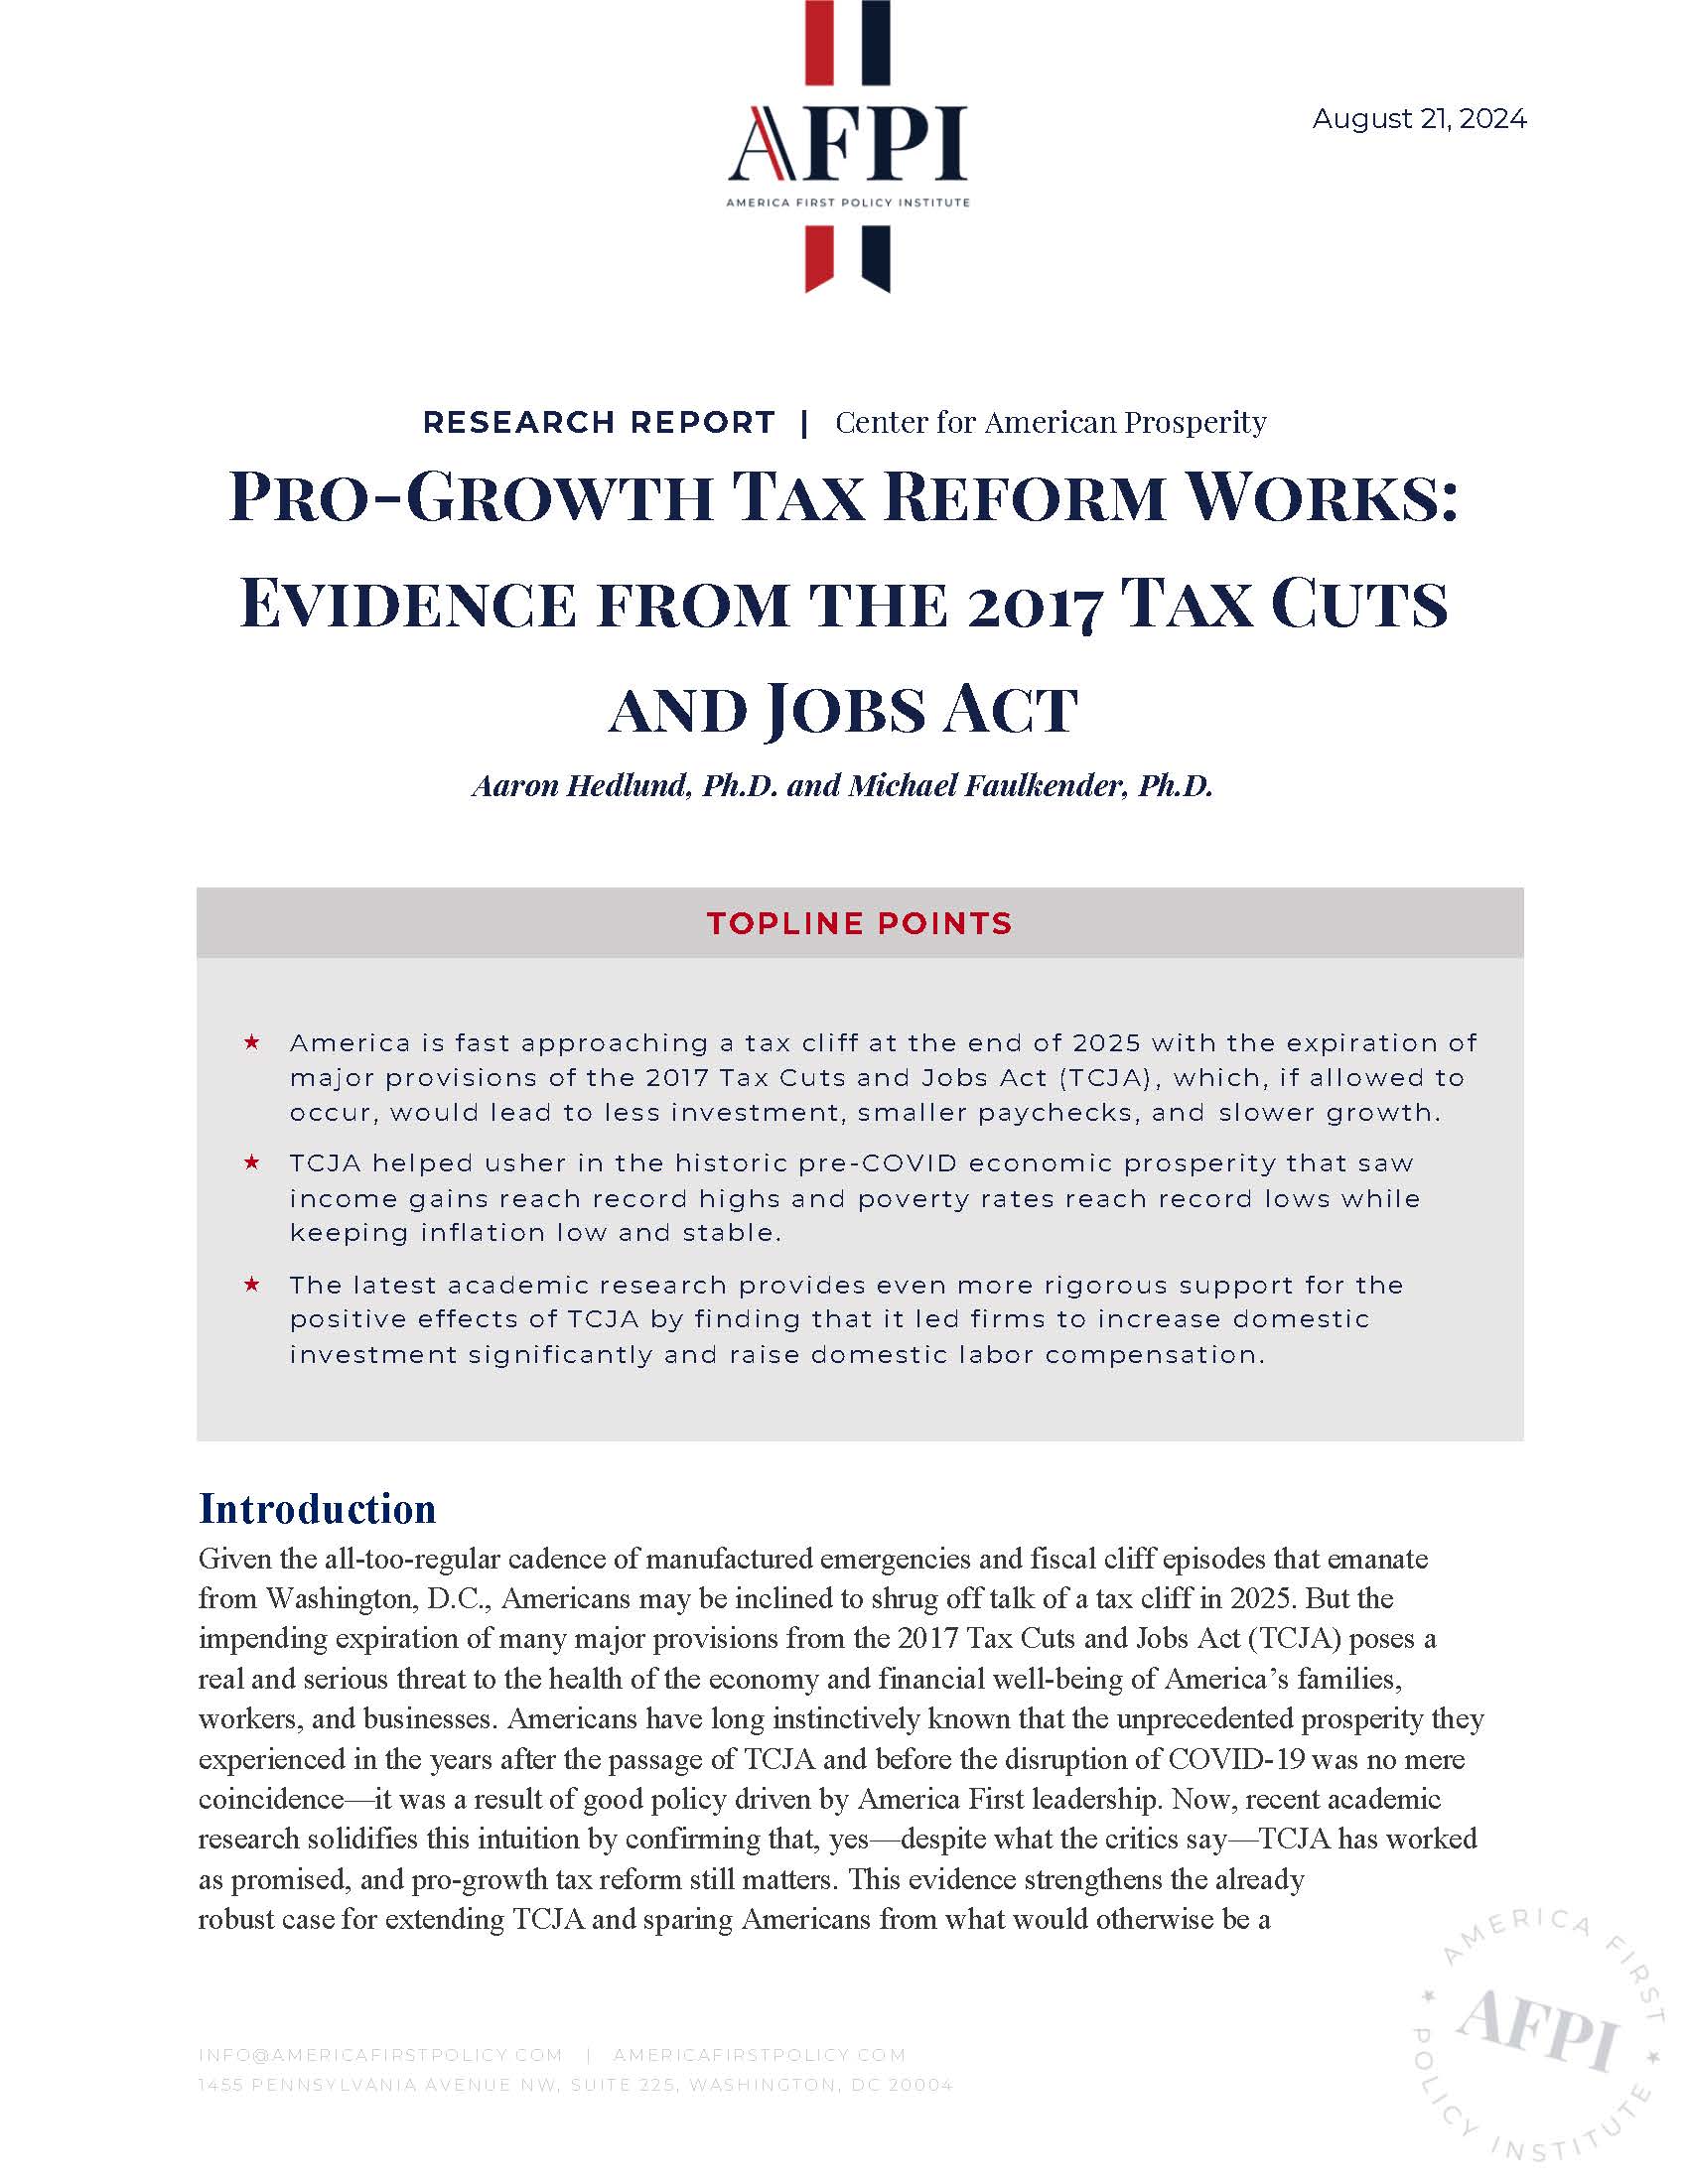
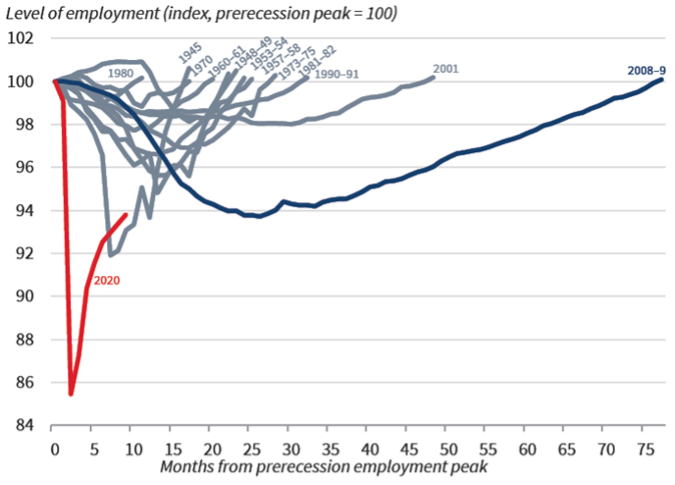
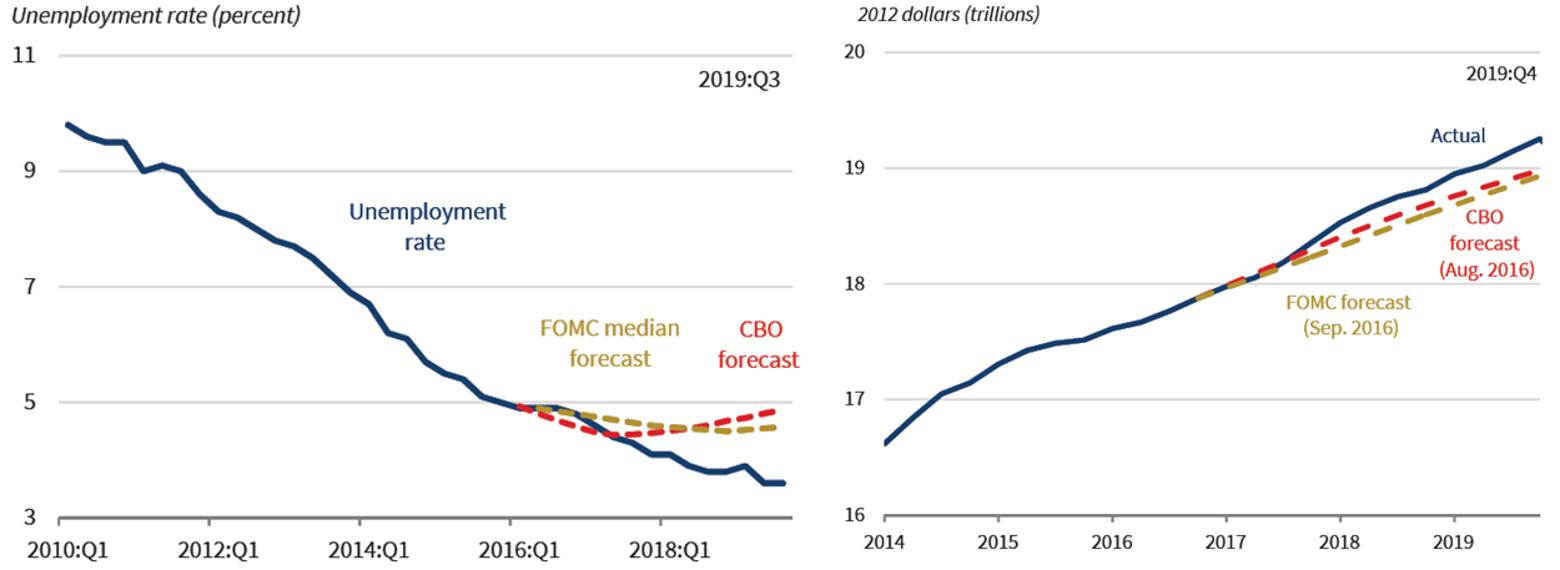
In the aftermath of the 2007-09 financial crisis, the progressive Left’s tax-spend-bailout-redistribute approach to fiscal policy produced the most anemic economic recovery in modern American history, as seen in Figure 1 below. Although the duration of the expansion was long, Census data show that families did not see any gain in living standards between 2007 and 2015 (Census, 2022). By 2016, the Federal Open Market Committee and Congressional Budget Office (CBO) were forecasting the labor market recovery to stall and unemployment to persist. Total nonresidential investment was stagnant, equipment investment was already falling, and tax revenues as a share of GDP were declining due to deteriorating economic activity. Figure 2 on the following page depicts this economic slowdown.
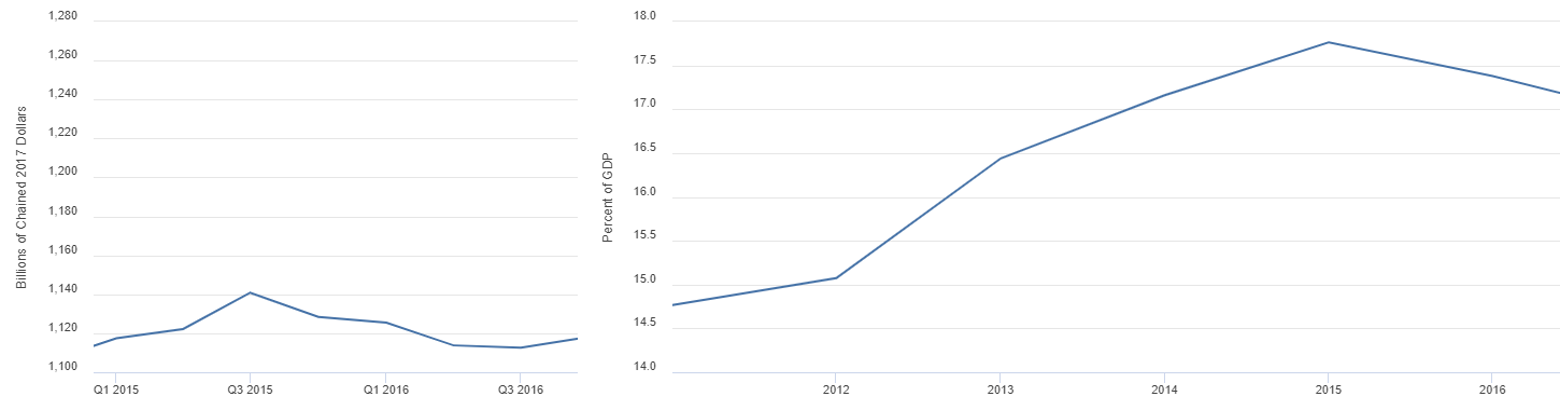
After the 2016 election, President-elect Trump made clear his intention to pursue pro-growth tax reform, and the Trump Administration spent much of 2017 working with Congress to craft TCJA. On the corporate side, TCJA instituted far-reaching reforms to make the United States more globally competitive, including reducing the tax rate from one of the highest in the world at 35 percent (as shown in Figure 3 below) to 21percent and shifting from a global to a territorial tax system to encourage companies to repatriate foreign earnings. Notably, even with such a high corporate tax rate before TCJA, the United States collected less revenue from the corporate tax, measured as a share of GDP, than other countries in the OECD (Organisation for Economic Cooperation and Development) with lower tax rates (CEA, 2018). On the individual side, TCJA reduced marginal tax rates across the board, doubled the standard deduction and the child tax credit, and reduced federal tax penalties associated with moving from high-tax to low-tax states and from making larger home down payments. TCJA also instituted a 20 percent pass-through deduction for small businesses and immediate expensing of equipment investment. It also created the Opportunity Zones program to help solve the problem of generational poverty in distressed communities by attracting private investment and jobs.
The basic architecture of TCJA was rooted in well-established economic theory validated by a plethora of rigorous empirical studies. One central premise of sound tax policy is the recognition that people respond to incentives, whether in their roles as workers, consumers, investors, or entrepreneurs. In particular, a wide body of research finds adverse consequences of high taxes for labor market participation, wages, investment, innovation, productivity, growth, and living standards. For example, academic papers such as one by Kaygusuz (2010) find that marginal rate reductions in the 1981 and 1986 tax reforms explain more than 20 percent of the increase in female labor force participation that occurred in the wake of their enactment. Research has also found that workers and consumers bear much or even most of the burden of corporate taxes, with effects coming through lower earnings and higher prices (Desai et al., 2007; Peichl et al., 2017; Baker et al., 2023). Chapter 1 of the 2018 Economic Report of the President contains a thorough review of the academic literature documenting the economic costs of high tax rates and of the corporate tax, in particular. None of this is to say that all tax cuts are equally effective at promoting broad-based growth. On the contrary, the TCJA reforms described earlier specifically sought to redress the most egregious offenders in America’s tax code, which were depressing investment and incomes and incentivizing offshoring.
The Economic Prosperity Produced in the Wake of TCJA
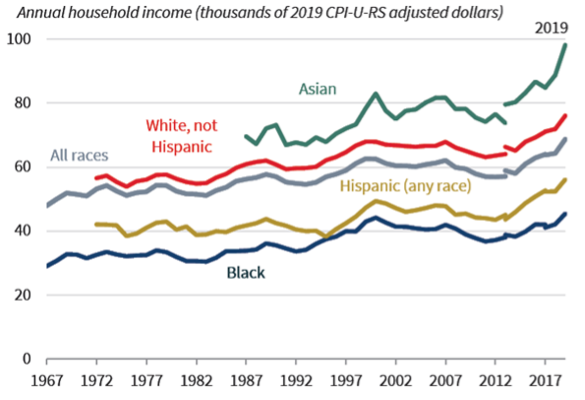
The years immediately after the enactment of TCJA can best be described as a blue-collar boom. The U.S. economy from 2017–2019 eclipsed pre-election forecasts in 2016 for GDP and unemployment, as shown in Figure 4 below. Incomes surged, and inflation was tame (and remained that way until the reckless stimulus and regulatory policies of the Biden-Harris Administration). Headline unemployment fell to 50-year lows, and a more inclusive measure that captures discouraged workers on the sidelines and part-time workers who would prefer a full-time job reached an all-time low in December 2019. Labor market opportunity reached every corner of America. The unemployment rate for African Americans and Hispanics fell to record lows, and Americans with lower levels of formal education experienced historic employment success. While worker earnings overall grew at more than a 40 percent faster rate from January 2017 to February 2020, when compared to the period from July 2009 to December 2016, the acceleration in earnings was 130 percent for workers without a bachelor’s degree and 158 percent for the bottom 10 percent of wage earners. Workers in the top 10 percent also saw their earnings rise but at a slower pace than workers at the bottom, who disproportionately benefited from a historically strong labor market. This robust employment and wage growth manifested itself in record-low poverty rates and the largest household income gains in history. As shown in Figure 5 below, real (inflation-adjusted) median household income rose by more than $6,000 after 2016 and by a record $4,400 in 2019 alone—more than in the entire 17-year period from 2000 to 2016 (CEA, 2021). By contrast, real median household income has fallen by around $2,000 since the inflationary surge that began in spring 2021.
Assessing TCJA’s Role in Creating Historic Prosperity
Criticisms of TCJA broadly fall into two camps. In one camp, progressives engage in wholesale denialism about the state of the economy during the Trump Administration, electing either to ignore the statistics outlined above, ascribe them to the Obama Administration, or write them off as nothing more than a temporary sugar high (JEC, 2020). Recently, a second camp of criticism has opened up with some dissenters on the right who have also embraced the “sugar high” narrative, disputed the notion that TCJA contributed to any of the pre-COVID prosperity, and decried the push for TCJA extension and further pro-growth tax reform as a manifestation of market fundamentalism (American Compass, 2023; Cass, 2023). While the progressive denialism is patently absurd on its face in light of the economic statistics and inflection points described in the previous section, the claims by the second camp that the blue-collar boom had little to do with TCJA necessitate refuting.
Claim: TCJA Did Not Boost Investment
The central claim in this latter critique is that tax cuts are supposed to work by spurring business investment and that TCJA failed to do this. To begin with, the premise itself is faulty—that the only mechanism by which tax cuts affect growth is through business investment. In reality, tax cuts affect investment decisions, hiring decisions, household labor supply, education decisions (and other modes of human capital accumulation), innovation, and beyond. There is robust evidence for pro-growth tax policy operating through each of these mechanisms (Hedlund, 2019, 2020). That said, it is still important to assess how TCJA affected investment since its investment-boosting potential was a key selling point.
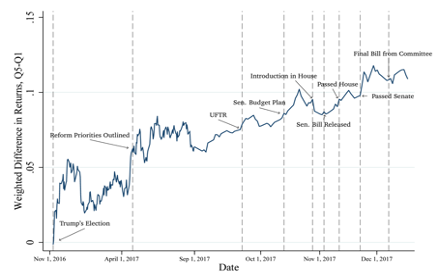
To advance the argument that TCJA did not boost investment, a recent piece claims that growth in real business investment was no different in 2018, at 5.6 percent, than it was from the third quarter of 2009 through TCJA’s passage in the fourth quarter of 2017, at 5.8 percent (American Compass, 2023). There are a couple of problems with this analysis. First, the choice of time period is flawed. Starting the pre-TCJA time window in 2009 is too early, for it includes many confounding macroeconomic events, such as the recovery from the financial crisis and multiple rounds of quantitative easing. Second, stopping the pre-TCJA window and starting the post-TCJA evaluation period at the date of TCJA’s final passage—while it sounds intuitive—misses the fact that businesses began responding to the prospects of tax reform as soon as President Trump won the 2016 election and as the details of TCJA became clearer throughout 2017. As support for this contention, Chodorow-Reich et al. (2024) show that the stocks of more investment-intensive companies began to pull away from those of less investment-intensive companies—which did not stand to benefit as much from TCJA pro-investment reforms—as soon as President Trump won the 2016 election, with the gap widening throughout 2017 as policy details became clearer and the likelihood of passage increased. In short, the expectation of TCJA enactment began affecting the economy in some ways even before its final passage as people made forward-looking decisions in anticipation of TCJA becoming law.
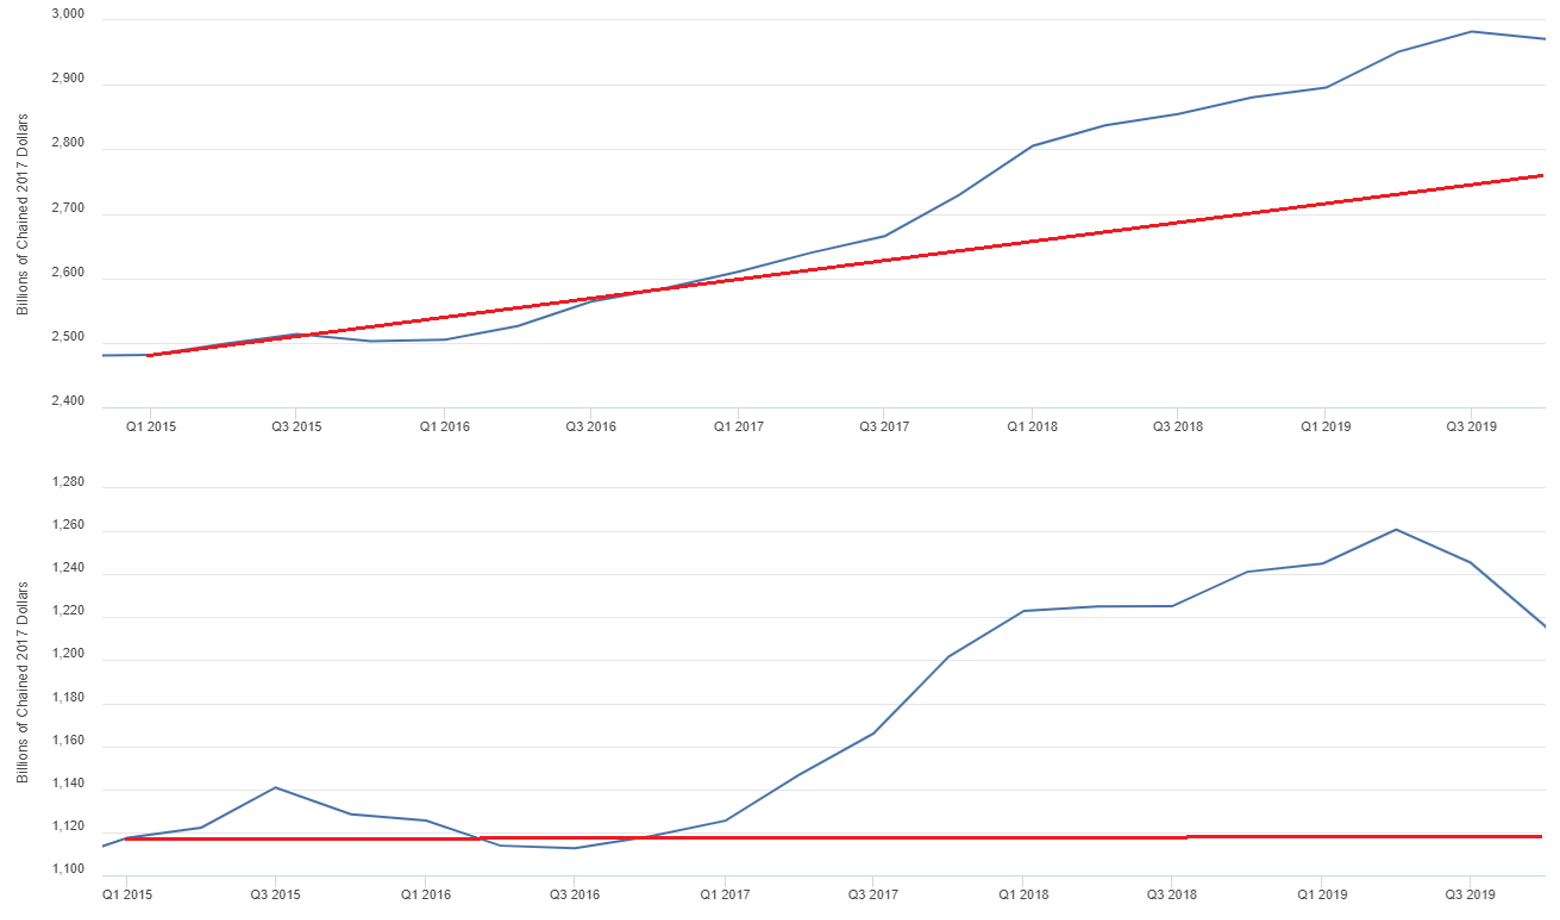
A more appropriate time window for looking at investment is from 2015 through the 2016 election, relative to investment from the 2016 election until the end of 2019. Under this comparison, the annual growth rate of real nonresidential fixed investment improved from 2.4 percent to 4.8 percent. In fact, even this simple comparison shortchanges TCJA because it does not strip out the dampening effect on investment of the interest rate hiking campaign that the Fed waged throughout 2017 and 2018 and that peaked in 2019 with rates rising by more than two percentage points. If one instead looks at approximate two-year windows—2015 through the 2016 election and then the 2016 election through the end of 2018—investment growth improved from 2.4 percent to 5.6 percent. As the author of the TCJA critique correctly points out, TCJA tax incentives were particularly salient for equipment investment. With that in mind, equipment investment growth improved from 0 percent in the pre-TCJA window to 2.8 percent over the full post-TCJA window and 5.4 percent over the shorter post-TCJA window, which omits the peak of the rate hiking cycle. Either way, these more appropriate “bird’s eye view” comparisons suggest that TCJA had a substantially positive effect on investment. To give a more tangible sense of magnitude, annual real investment was more than $208 billion (7.5 percent) higher at the end of 2019 than would be predicted by an extrapolation of the trend from 2015 through the 2016 election. Equipment investment alone was nearly $100 billion (8.6 percent) higher. Figure 7 displays the actual path of both types of investment relative to the extrapolated trend.
Given the presence of confounding factors like the previously mentioned Fed rate hikes, even this bird’s eye view or “snapshot analysis” does not give a sufficiently accurate or precise measure of TCJA’s impact on investment. Thankfully, the recent academic paper by Chodorow-Reich et al. (2024) fills this void through a more rigorous empirical analysis using firm-level corporate tax return data. This detailed data allows the authors to separately calculate firm-specific marginal tax rates and effective costs of capital before and after TCJA for both domestic-generated and foreign-generated (in the case of multinationals) income. The authors account for the differential impact of TCJA on individual businesses and control for a number of other variables, which allows them to measure the causal impact of TCJA on business investment more precisely. The main findings of interest in the paper regarding the investment critique are:
- Firms that experienced the average change in their marginal tax rate and cost of capital from TCJA increased domestic investment by 20 percent because of the policy, with the authors finding strong evidence for “a causal interpretation of the post-TCJA responses.” In addition, they found that domestic labor compensation increased.
- The positive effect of TCJA on investment strengthened, not weakened, from 2018 to 2019.
- The estimates imply a “model-free” long-run increase in corporate capital of 16 percent. Taking into account the model-implied boost to wages, the long-run increase in capital is 7 percent.
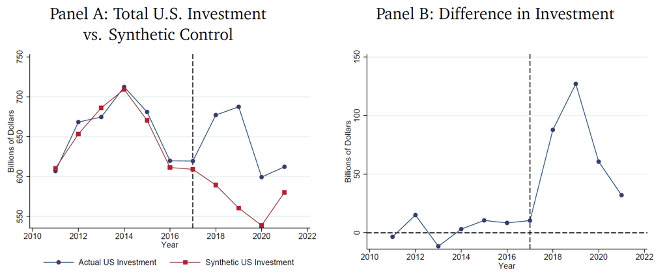
- A synthetic control analysis that compares publicly traded U.S. firms to similar firms headquartered outside the U.S. finds “the aggregate capital expenditure of U.S. firms in 2018 and 2019 greatly exceeds the aggregate capital expenditure of the control group.” In other words, TCJA had a strong domestic investment effect.
The last finding is worth discussing further. In the authors’ synthetic control analysis, the control’s investment actually declined in 2018 and 2019, whereas U.S. investment increased, as shown in Figure 8 below. Thus, even simply comparing U.S. investment before and after TCJA is not a good indicator of the effect of TCJA because it implicitly assumes that a zero effect of TCJA would manifest as no change in investment, whereas, in reality, investment absent TCJA still would have been affected by other confounding factors. In this case, those other confounding factors (like the Fed rate hiking campaign) would have pushed investment to decline. Overall, the domestic investment boost due to TCJA comes out to more than $100 billion per year in 2018 and 2019 alone. The authors conduct a number of robustness checks to subject their findings to further scrutiny, which leaves their conclusions intact.
Claim: TCJA Did Not Boost Economic Growth
The critique of TCJA’s economic growth effects discussed earlier follows the same basic logic as the critique about investment—namely, by comparing economic growth from the period between Q3 2009 and Q4 2017 to the period between Q4 2017 and Q4 2019. For the reasons discussed previously, it is better to look at a pre-TCJA window of just 2015 through the 2016 election and a post-TCJA window that starts after the 2016 election. If one extrapolates the 1.9 percent economic growth rate from the pre-TCJA period through the end of 2019, GDP would have grown by $1.7 trillion. In reality, real GDP grew at a 2.5 percent annual rate and rose by $2.3 trillion.
Another method for considering the impact of the policy on growth is to examine the differences between various indicators of actual economic performance and forecasts that do not incorporate future or potential policy. The CBO, for instance, does not consider future or potential policy in its semi-annual economic projections. The Federal Reserve, and in particular the members of the Federal Open Market Committee (FOMC), make it clear that they do not consider future or potential fiscal policy in the formation of their forecasts so as not to invite an appearance of being political. Importantly, these projections tend to carry more significance and greater accuracy in the short and medium run, which is compatible with the focus of this report on the period before the onset of the pandemic.
The final CBO forecast and the FOMC Summary of Economic Projections (SEP) before the passage of TCJA both came in June of 2017. Actual real GDP growth outpaced both projections, notably in the pre-pandemic period, with real GDP growing at a 2.7 percent annualized pace from 2017:Q4 through 2019:Q4. Once adjusting for the multiple rounds of BEA revisions that are retroactively applied, the CBO projected before TCJA that the economy would expand at just a 1.7 percent pace over the same period. While growth in the first year after TCJA’s passage matched the median FOMC projection from the pre-TCJA SEP (2.1 percent fourth-quarter to fourth-quarter growth), actual growth far outpaced the median FOMC projection in the subsequent year. From 2018:Q4 to 2019:Q4, the median FOMC member projected growth of 1.9 percent relative to the observed growth rate of 3.2 percent.
The outperformance of the economy relative to baseline forecasts that did not incorporate the passage and implementation of TCJA stretches well beyond headline growth. In particular, the capital deepening process had a measurable effect on labor productivity. Labor productivity growth accelerated in the two years following TCJA’s passage, but it also eclipsed the trend growth. In the two years after TCJA, labor productivity in the nonfarm business sector grew 2.0 percent at an annual rate, more than double the trend rate of 0.9 percent. Labor productivity also outperformed the CBO projection (1.8 percent), and it bucked the trend of most other advanced economies, which faced lower and declining labor productivity growth rates compared to the accelerating U.S. rate (CEA, 2020).
With a more productive labor force, firms’ demand for labor grew far more than forecasters anticipated. By the eve of the pandemic in 2019:Q4, the unemployment rate had dropped by 0.6 percentage points from 2017:Q4 to hit 3.6 percent. The CBO had anticipated slack would build over that period, with an unemployment rate increasing by 0.2 percentage points to 4.4 percent, while the median FOMC projection was for a marginal decline in the rate (-0.1 percentage points) to 4.2 percent. The outperformance in the declining unemployment rate occurred as the labor force expanded, breaking from the trend and surpassing expectations. Despite an aging population, the overall labor force participation rate rose by 0.6 percentage points—above the trend projection—and relative to an anticipated decline in participation, with the CBO projecting before TCJA’s passage that the participation rate would decline by 0.3 percentage points over the same period. The miraculous tightening of the labor market to historic lows brought countless Americans off the sidelines, re-engaging them with the dynamism of the American economy as real wage growth surged. The U.S. economy added nearly three times as many jobs (+4.3 million) in the two years following passage of TCJA as the CBO projection had anticipated (+1.6 million).
Amid this resounding and robust response to TCJA of faster growth and a tightening labor market, income for the typical American household surged, breaking a nearly two-decade period of stagnation. Between 2017 and 2019, real median household income rose $6,160 to the highest level on record ($78,250). What is more, and as has been discussed, these growth outcomes had a greater effect on lower-wage households than on high-income households and occurred amid a monetary tightening cycle and global headwinds to growth from both China and Europe.
Claim: TCJA Exploded the Deficit
Some critics have also asserted that TCJA decimated federal revenues and exploded the deficit. The best way to address this fiscal fallacy is to start by setting the facts straight about the tax environment after TCJA was implemented. In fiscal year 2022, federal receipts were equal to 19 percent of the aggregate economic output of our Nation, the second highest since World War II. Between fiscal year 2017 (pre-TCJA) and fiscal year 2022, corporate income tax payments rose from $297 billion to $425 billion, an increase of 43 percent. Personal income tax collections rose from $1.6 trillion in 2017 to $2.6 trillion in 2022, an increase of 66 percent. Over that same five-year period, inflation was 20 percent (with the lion’s share of the increase occurring in 2021 and 2022), so these revenues to the federal government grew much faster than inflation.
To compare spending with revenues, federal outlays between fiscal year 2017 and fiscal year 2022 grew from $4 trillion to $6.3 trillion over that same five-year period. According to the CBO’s latest 10-year Budget and Economic Outlook, spending for the next 10 years will continue to be in the 23 percent to 24 percent of GDP range, far in excess of the 20.3 percent it averaged in the 50 years before the pandemic. Such a sustained and dramatic increase in spending during a time of low unemployment and moderate economic growth will be inflationary. Running large budget deficits to fund more subsidies for housing, energy, and higher education will just cause prices to rise even further. That is why Larry Summers characterized the economic policies of this administration as “the least responsible macroeconomic policies we’ve had in the last 40 years” (Bloomberg, 2021). These facts also should make one thing clear in any discussion of deficits: The federal government has a spending problem, not a revenue problem.
Claim: TCJA Exacerbated Inequality
Progressives reserve their most vociferous critique of TCJA on the grounds that it supposedly exacerbated inequality. Putting aside one fundamental flaw of the perpetual progressive obsession with equity—that it presumes equality of outcomes is a superior policy objective than equality of opportunity—the data here are not even supportive of the accusation. To the contrary, income and wealth inequality narrowed post-TCJA, not because of any top-down redistribution to punish the “haves” in favor of the “have nots,” but because the historically robust economic boom ushered in by TCJA brought in a tide that especially lifted the most underserved.
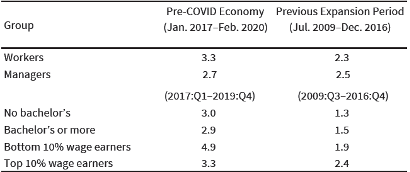
Beginning with earnings inequality, Table 1 above shows that earnings growth accelerated across the board with the arrival of pro-growth tax and deregulatory reform in the pre-COVID economy. Moreover, workers benefited more strongly than managers, those without a bachelor’s degree more so than those with a bachelor’s degree or higher, and the bottom 10 percent of wage earners to a greater extent than the top 10 percent. For example, those with less formal education saw their earnings jump by a factor of 2.3 (from Table 1, 3.0/1.3 = 2.3), while the earnings of those with more schooling jumped by a factor of 1.9 (from Table 1, 2.9/1.5 = 1.9). The difference is even more dramatic when comparing those at the top to those at the bottom of the earnings distribution. The earnings of workers in the bottom 10 percent jumped by a factor of 2.6 compared to a factor of only 1.4 for workers in the top 10 percent. Far from making it a zero-sum competition between people at different points of the earnings distribution, what these findings confirm is that a growing economy creates an environment where everybody can prosper. By contrast, even when tax hikes are used to fund redistribution to lower-income households, those households end up worse off because deteriorating economic performance causes their overall income to fall (Jones, 2022).
TCJA also increased the progressivity of the income tax code. In 2017, the top one percent of earners paid 39 percent of income taxes, and that share increased to 42 percent in 2020. According to recent data issued by the Internal Revenue Service, in fiscal year 2021 (the latest year for which the data has been made publicly available), the top one percent of households earned 26.3 percent of total adjusted gross income but paid 45.8 percent of total federal income taxes. For perspective, the bottom 70 percent of households earned 23.3 percent of aggregate income and paid 8.2 percent of federal income taxes.
Turning from income and earnings to wealth, the Federal Reserve’s Distributional Financial Accounts data reveal that real wealth inequality declined in the four years through 2020 (Clingenpeel & Goodspeed, 2021). Moreover, the wealth held by households in the bottom half of the wealth distribution grew almost three times faster than the wealth held by households in the top one percent. Looking specifically at the period from the 2016 election through the end of 2019, before the pandemic, real wealth for the bottom half grew at an annual 17.2 percent rate, compared to only 5.2 percent for those in the top 1 percent. After TCJA, the bottom half began to outpace the top 1 percent by an even faster 4-to-1 margin. Only after TCJA did real wealth for the bottom half surpass its 2007 level from before the financial crisis and subsequent anemic recovery.
Conclusion
Properly conceived and executed, pro-growth tax reform is an established, successful approach to increasing opportunity and enhancing innovation—activities that are foundational to economic prosperity. America First economic policy advocates for affordable abundance realized through greater capital investment, human capital accumulation, innovation, and hard work.
The 2017 Tax Cuts and Jobs Act was passed at a pivotal time—with the economy showing renewed signs of weakness after what had already been years of an anemic recovery—and addressed America’s most pressing economic vulnerabilities, such as its globally uncompetitive corporate tax code and stagnant living standards. Contrasted with the big government socialism tendencies of the Biden-Harris Administration that empower government bureaucrats to direct the allocation of resources in the U.S. economy through higher taxes, spending, and regulation, TCJA trusted in the superior judgment and greater competency of workers and entrepreneurs to allocate resources toward creating more growth and opportunity. As it has countless times in America’s history, betting on the American people worked. The evidence compellingly demonstrates that TCJA helped usher in historic prosperity with record-high income growth and record-low poverty rates, all while maintaining low and stable inflation and healthy federal revenues.
Tax reform is an essential element of pro-growth economic policy; without it, prospects for ensuring America’s continued economic dominance become unnecessarily dimmed. Given the rampant inflation of the past few years, which continues to reverberate throughout the economy, the ongoing challenge of labor shortages—especially in the face of an aging population—and the economic threat posed by China, it would be economic policy malpractice for America to leap off the tax cliff in 2025 by allowing TCJA to expire.
Resources