The Biden-Harris Gas Gouge: Consumer Gasoline Spending Across 5 States
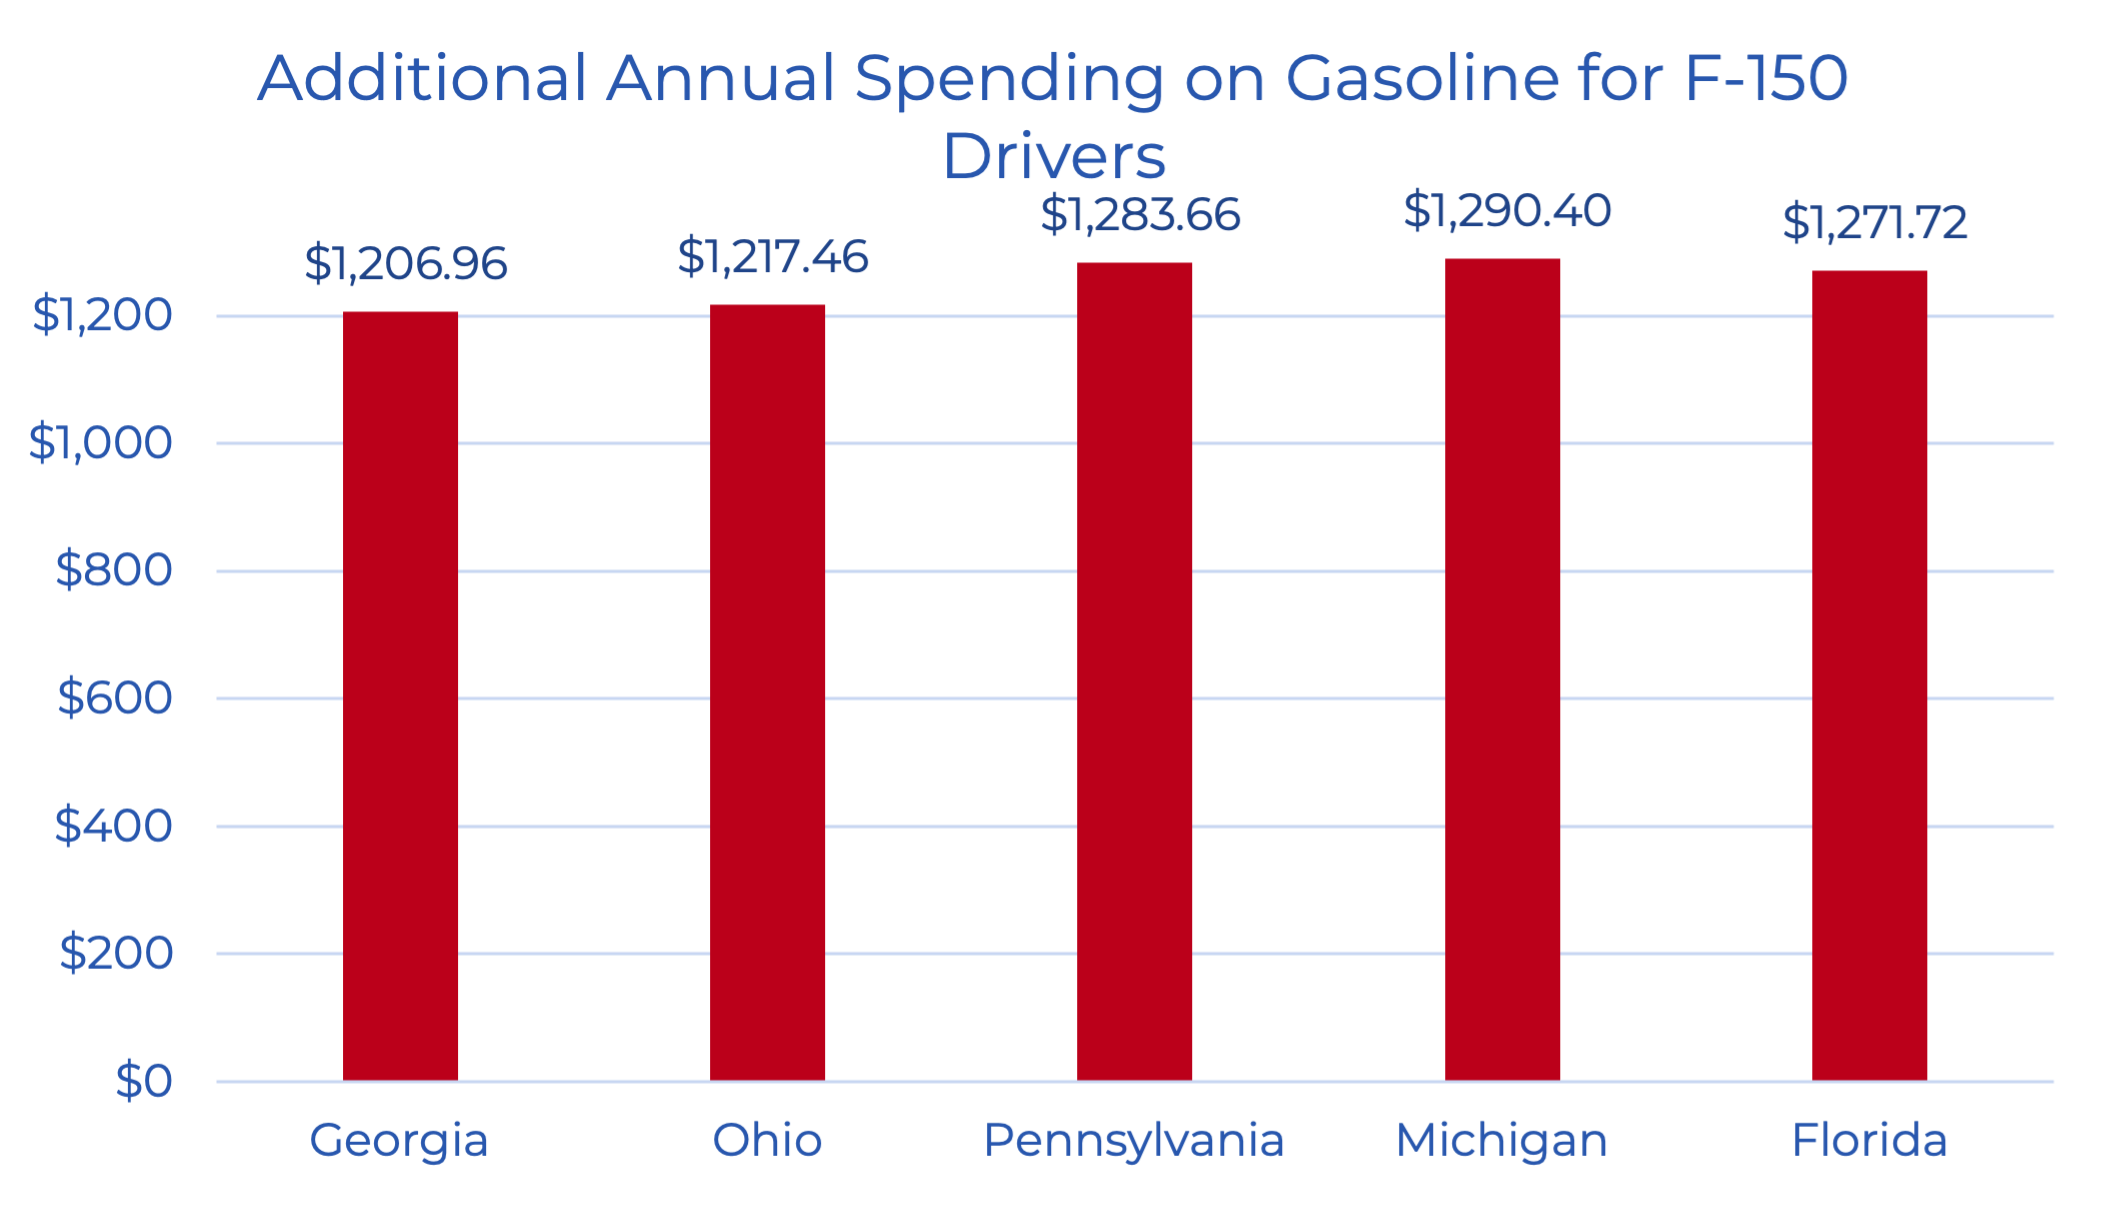
Annual gas spending up more than $1,000 for F-150 drivers
The Biden-Harris Administration’s energy policies prioritize lowering the Nation’s greenhouse gas emissions over lowering prices. This agenda includes efforts to restrict and raise the cost of fossil fuel production on federal land, limit the development of pipelines, slow the federal permitting process, discourage investment in fossil fuel production and refining, and restrict the end-use of fossil fuels.
The results of these policies are multi-fold: American crude oil production is several million barrels lower than what would have been produced if the Biden-Harris Administration continued the America First policies of the Trump Administration, and the Nation’s refining capacity remains below its pre-pandemic peak. Consequently, American consumers bear the burden of artificially high energy costs because of the intentional policy choices of the Biden-Harris Administration.
These artificially high energy costs can be quantified by calculating and comparing the annual gasoline usage under the prices of the Trump and Biden-Harris Administrations:
- The average age of a light truck on the roads is 11.8 years, meaning that the average model year is 2012 or 2013.
- The Ford F-150 is one of the most popular and recognizable light-duty trucks in America, and in model years 2012 and 2013, it had a fuel efficiency of at least 13 miles per gallon.
- In recent years (2017-2022), Americans drove an average of 16,152 miles each year. F-150 drivers, therefore, purchased an average of 1,242.5 gallons of gasoline each year.
- Multiplying that annual gasoline consumption by the average difference in local-level gas prices between the Trump and Biden-Harris Administrations provides an indication of how much more F-150 drivers have paid for gasoline due to the current administration’s policies. Calculations for five states are shown below:[1]

[1] State selection reflects BLS data availability for Atlanta, Cleveland, Philadelphia, Detroit, and Miami, comparing January 2017 – January 2021 to January 2021 – May 2024.
