The Costs and Burdens of Inflation and Its Relationship to Policy
KEY TAKEAWAYS
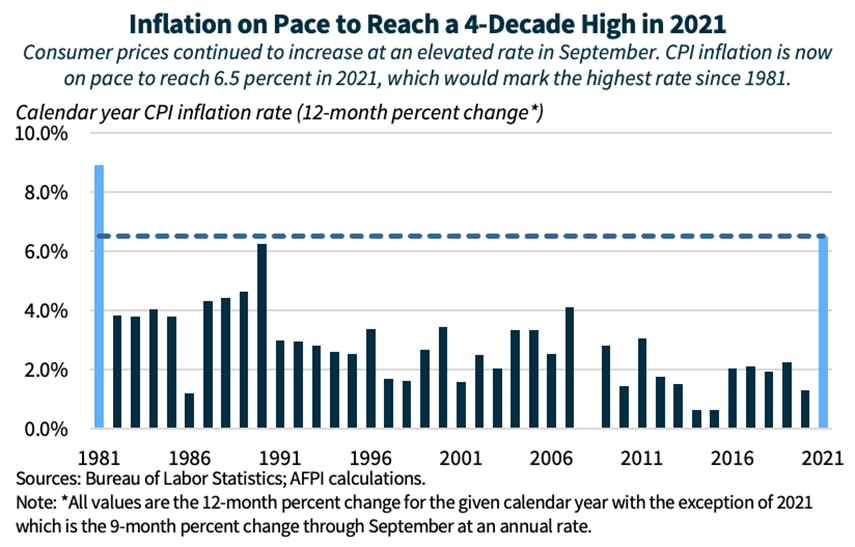
- Consumer price inflation, as of September, is on pace to reach the highest rate of any calendar year since 1981, having risen at a 6.5 percent annualized rate in the first 9 months of 2021.
- This high rate of inflation has eroded all 2021 wage gains for the average worker and amounts to an “inflation tax” of over $500 for the average full-time worker.
- This inflation tax burden falls disproportionately on middle- and low-income families: research has found that the volatility of the consumer price index for the high-income basket of goods is 38 percent lower than that for the middle-income basket of goods.
- Higher rental prices, producer price increases amidst supply chain disruptions, and a record high share of small businesses reporting their intent to raise prices over the next three months indicate further inflationary pressures over the next several months.
- Despite President Biden’s insistence to the contrary, reckless fiscal policy in 2021, such as the $1.9 trillion in stimulus spending passed earlier this year, is very likely contributing to current high rates of inflation. These policies simultaneously stimulate demand while constraining supply, disincentivizing work and production.
- Going forward, the big government socialism bill creates substantial risks for further increases in inflation, interest rates, or both that threaten to increase living costs for struggling families.
INTRODUCTION
Two macroeconomic phenomena—inflation and stagnating output growth—have garnered the interest and concern of both the public and policymakers. Understanding the dynamics of both these economic forces and how large a threat they potentially pose to American workers and families should be a key step before any major government spending or regulatory actions are undertaken, as such policy interventions could further threaten the fragile economic recovery. This issue brief examines the costs of inflation thus far incurred to the economy as a whole, who bears those costs, and the risks that current federal policy could contribute to rising living costs for the foreseeable future.
INFLATION IN 2021
Recently, the Bureau of Labor Statistics (BLS) released September data for the Consumer Price Index (CPI) (BLS, 2021). The release confirmed that consumer prices continued to rise at an elevated pace in September, growing 0.4 percent from August. The 0.4 percent monthly increase was above the expectations of economists (0.3 percent) and up from the monthly growth in August (0.3 percent) (Pellejero, 2021). While this monthly inflationary increase is slightly below the average monthly pace of 0.5 percent set in the first 8 months of 2021, it is still far above the average monthly increase set in the pre-pandemic 2017-19 era of 0.2 percent. As of September, CPI inflation has reached a 6.5 percent annualized rate in the first 9 months of 2021. Should consumer prices continue to rise at this average rate through the end of the year, 2021 will mark the highest inflation rate for any calendar year since 1981, as shown in the figure below. For this annual rate of 6.5 percent to hold for the remainder of 2021, the CPI would only have to increase on average 0.5 percent per month from October to December. 0.5 percent is the average monthly increase experienced so far in 2021.
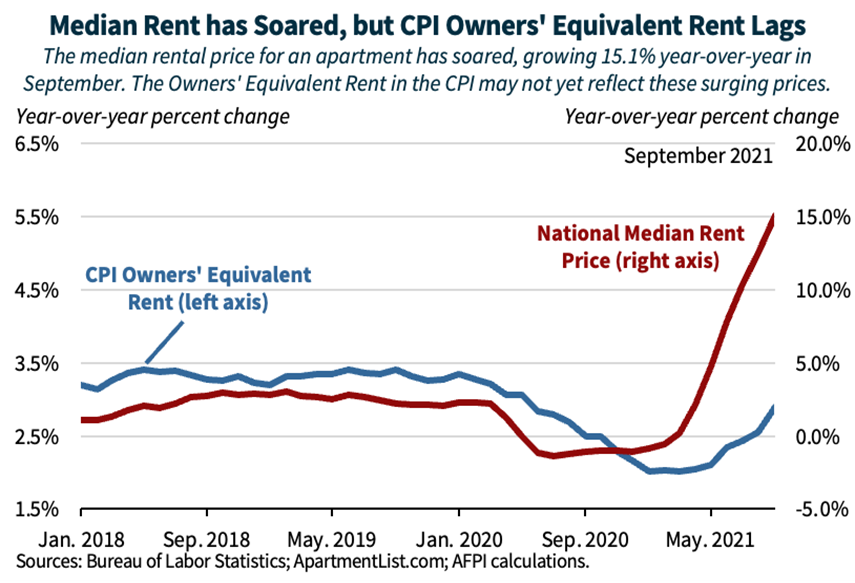
Inflationary pressure is not likely to quickly subside. One particular source of that pressure that may not yet be fully represented in official government data is rental prices. A number of private sector organizations that track rental prices have reported a substantial rise in rental prices across the country in 2021. Apartment List reports that, year-to-date, the median rental price nationally has risen by 16.6 percent as of September (Salviati et al., 2021). Over the same period, the CPI component owners’ equivalent rent of primary residence (OER)—a measure of the implicit rent that homeowners would pay if renting—has risen just 2.5 percent, while rent of primary residence has risen 2.0 percent. Together, these two categories represent roughly one third, or 32.1 percent, of the representative basket of goods and services used to construct the CPI. As such, price increases in these two components can heavily impact overall inflation. As the private sector rent indicators surge far higher than indicated by the official CPI rent measures, as shown in the figure below, it may be an indication that rising rental prices are not yet fully reflected in the CPI and could be a source of future inflationary pressure.
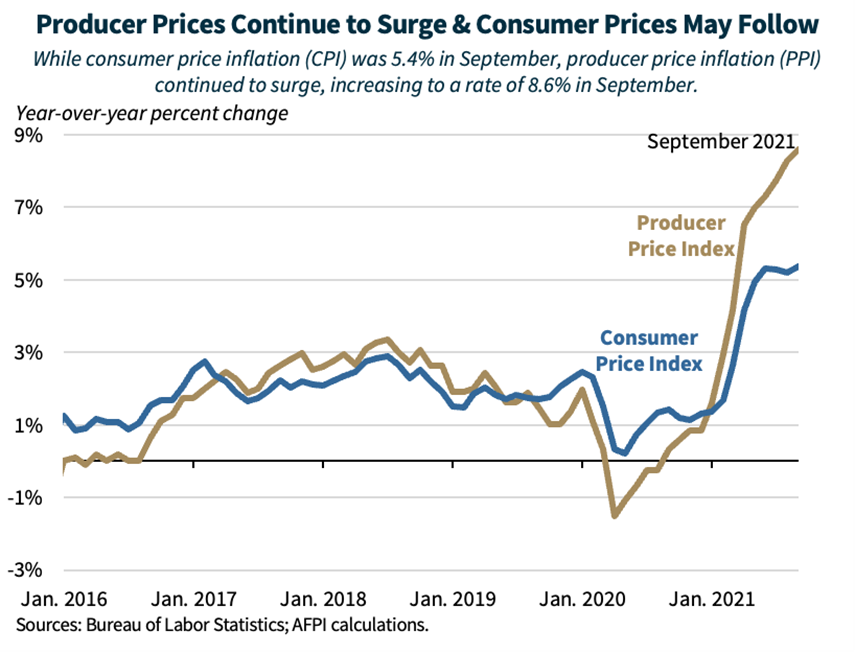
Amidst continued supply chain disruptions, producer prices continue to climb at a high rate. As of September, the producer price index (PPI) had risen at a 10.7 percent annual rate in the first 9 months of 2021, relative to an increase in the CPI over the same period of 6.5 percent. While the year-over-year growth rate in the CPI has stalled, albeit at a very high rate, in the past few months, the year-over-year change in the PPI has continued to rise, as shown in the figure below. Though the relationship between the PPI and CPI, and the extent to which high producer prices are passed through to consumer prices, is not certain, research has suggested that the PPI may have some positive effect on the CPI (Li et al., 2019). What is certain is that the continued supply chain disruptions, as well as a shortage of willing and qualified workers, are risks for greater inflationary pressure. Indeed, the net share of small businesses reporting that they plan to raise prices in the next 3 months reached a record high of 49 percent in August and remained elevated at 46 percent in September (NFIB, 2021).
WHO BEARS THE BURDEN OF INFLATION?
For all the damage that high inflation can inflict on the economy overall, even more troublesome is the fact that it disproportionately affects the most vulnerable in society who have little recourse to escape its harmful consequences. The burden of rising inflation falls most heavily on families who spend a higher fraction of their income instead of saving—namely, low-income households (Dynan et al., 2004). Inflation further harms people at the bottom of the income ladder because of the differential impact it has on the basket of goods consumed by lower-income households, which is skewed more heavily toward basic necessities. Whereas households in the bottom income quintile spend 82 percent of their income on housing, food, transportation, healthcare, and clothing, high-income households spend just 67 percent of their income on these categories (Schanzenbach et al., 2016). Researchers have found that the volatility of the consumer price index for the high-income basket of goods is 38 percent lower than that for the middle-income basket of goods. In short, when inflation rises, those at the top are likely to see far smaller price changes than everyone else.
Many of the sectors and products that have been especially hard-hit by rising inflation also disproportionately affect low-income households. For example, what until recently was a bright spot for low-income financial fortunes—a declining share of income spent on transportation—has been turned on its head with used vehicle prices surging by more than 30 percent over the past year. Recent research examining the time period 2004-2015 attributes over 50 percent of this inflation inequality to less competitive pressure faced by firms catering to low-income households (Jaravel, 2019). The paper finds that increases in relative demand induce firms to create new product varieties and reduce price markups. Thus, policies that improve opportunity at the bottom—such as those in place during the previous administration which led to record low poverty and record high median income growth—help lower-income households by boosting competition, product innovation, and lower prices.
Inflation has another pernicious effect that extends beyond the immediate cost of goods and services, which is that it holds low-income families back from climbing up the wealth ladder. Multiple studies have pointed out that the least financially well-off are more likely to hold what little wealth they possess in non-interest-bearing accounts or—for those who are do not have a bank account—directly in cash, both of which erode in value when inflation is high (Albanesi, 2007; Erosa & Ventura, 2007). According to one prominent study, the elderly poor are especially hurt by surprise higher inflation. The study examined the case of a 5 percent inflationary episode, which just happens to be around the current inflation rate (Doepke & Schneider, 2006). By contrast, the financial portfolios of high-income households and middle-class homeowners are more likely to be hedged against inflation or, at times, can even benefit from it—such as when inflation devalues mortgage debt or stimulates asset prices. However, it is important to point out that middle-class households looking to become homeowners might find those dreams dashed by rising mortgage rates if markets anticipate that inflation is likely to remain persistently high (Garriga et al., 2017).
INFLATION AND POLICY
The renowned economist Milton Friedman once noted that “inflation is always and everywhere a monetary phenomenon” (Friedman, 1992). Put another way, whoever controls the money supply controls inflation, or at least has considerable leverage over it. In most developed economies, that responsibility resides with the central bank, just as it has in the United States for over a century since the establishment of the Federal Reserve. Historically, America’s commitment to central bank independence, fiscal solvency, and strong economic growth has given the Federal Reserve the tools—if not always the will—to maintain overall price stability regardless of the fiscal policy tax and spending plans pursued by Congress and the President.
However, this harmonious division of labor between the monetary and fiscal policy authorities does not inoculate Americans’ pocketbooks from the costs of reckless fiscal policy. Government spending-induced expansions in aggregate demand are inflationary in and of themselves, and while the Federal Reserve can hike interest rates to counteract this inflationary pressure, the consequence will be higher borrowing costs for American families. Thus, if the Federal Reserve chooses to respond passively to current fiscal policy actions, the big government socialism bill promises families higher inflation. If the Federal Reserve actively intervenes to keep inflation in check through interest rate hikes, the result is more expensive credit, making it more difficult for families to purchase vehicles, appliances, and even houses if mortgage markets perceive the hike in interest rates to be persistent. In other words, the prospect for households is “heads inflation wins, and tails households lose,” with costs of living rising in one form or another regardless. The big government socialism bill would compound this pain by acting as a massive negative supply shock to the economy through its combination of punishing tax hikes that discourage productive activity and starve the private sector of resources needed for investment and hiring. Such a shock could be reminiscent of the stagflation that the U.S. experienced in the 1970s, in direction if not in magnitude. On the one hand, the deterioration in the supply-side of the economy would itself contribute to higher inflation—as America has been witnessing over the past several months with ongoing labor shortages and supply chain disruptions. On the other hand, the Federal Reserve might be prompted to act aggressively sooner to stem such inflation by hiking interest rates, thereby raising borrowing costs and putting a damper on short-term growth prospects.
As troubling as these prospects are for American families, the deterioration in America’s long-term fiscal position due to the big government socialism bill could produce higher inflation for longer if the Federal Reserve becomes convinced that the only way to maintain a manageable debt servicing burden in the face of a spendthrift legislative and executive branch is to keep interest rates lower for longer regardless of rising prices. Such an outcome would reflect 2011 Nobel Prize winner Thomas Sargent’s assertion that “persistent high inflation is always and everywhere a fiscal phenomenon” (Eusepi & Preston, 2018). While seemingly at odds with Milton Friedman’s earlier quote, both statements can simultaneously be true. In short, reckless fiscal policy can put the Federal Reserve in the position where it feels the need to tolerate persistent inflation, thus effectively ceding some of its independence to irresponsible legislative and executive branches.
Whether this worst case scenario comes to pass is uncertain as of yet. However, there are reasons to be concerned about the judgment of the current Congress and administration. The year began with intense debate over the potential inflationary effects of the Biden Administration’s massive deficit-financed American Rescue Plan Act (ARPA). Larry Summers, former Treasury secretary under President Clinton and Director of the National Economic Council under President Obama, described the policy environment at the time of the ARPA’s passage as “the least responsible macroeconomic policies we’ve had in the last 40 years” and repeatedly warned of the inflationary consequences of the bill given the wave of borrowed money the government pushed into the economy at a scale completely out of sync with the economic hole at the time (Bloomberg Markets and Finance, 2021). These views were recently echoed by President Obama’s Chairman of the Council of Economic Advisers, Jason Furman, who noted that “the original sin was an oversized American Rescue Plan. It contributed to both higher output but also higher prices” (Tankersley, 2021). As the data presented in this paper show, higher prices certainly accompanied the ARPA, though output appears on the verge of stagnation (Federal Reserve Bank of Atlanta, 2021).
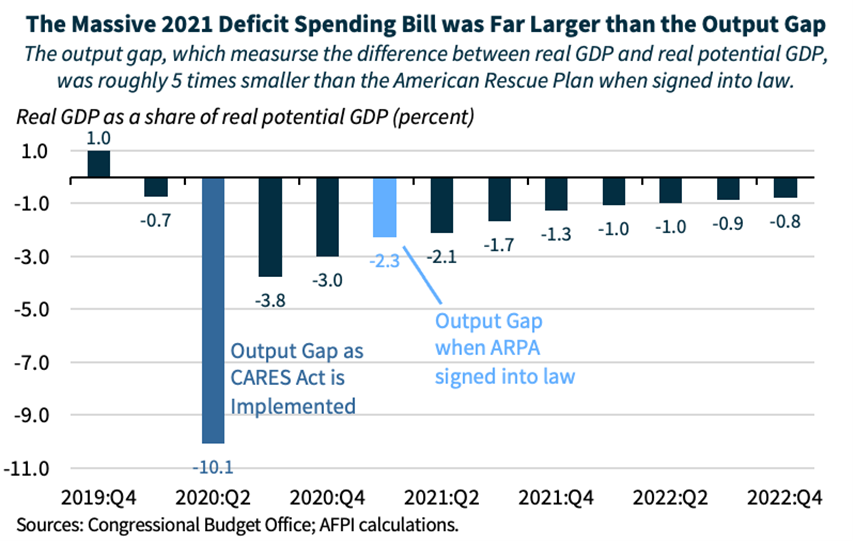
More concretely, the output gap offers an important barometer of the size of the remaining economic hole, and is useful as a comparison to the size of the policy response in the Spring of 2021. The output gap measures the difference between actual GDP and potential GDP, which the Congressional Budget Office (CBO) estimates as the maximum sustainable output of the economy given key factors such as productivity and the size of the labor force (CBO, 2021). At the worst point of the pandemic and ensuing recession, in 2020:Q2, the output gap stood at a staggering -10.1 percent, or -$1.9 trillion. This is the macroeconomic environment in which the Trump Administration and Congress ushered in the Coronavirus Aid, Relief, and Economic Security (CARES) Act—another multi-trillion dollar, deficit-financed spending package. However, in the Spring of 2021, after implementation of the CARES Act the following year, the CBO projected that the output gap had shrunk to only -2.3 percent ($-0.4 trillion) in 2021:Q1, far below the $1.9 trillion price tag of the ARPA passed and implemented at the same time, as shown in the figure below. In fact, the ARPA was roughly 5 times the size of the estimated real output gap at the time President Biden signed it into law. This is the macroeconomic environment in which Summers, and many others, highlighted the recklessness of massive deficit-spending that could lead to further inflationary pressure in excess of the inflation that might occur from lingering pandemic-related effects.
The Biden Administration’s approach and views of inflation in 2021 have been constantly shifting. In the early part of the year, Administration officials played down the risk of inflation. Treasury Secretary Yellen said, “I really don’t think that is going to happen” in response to other economists’ concerns that the ARPA could be followed by heightened inflation (Crutsinger, 2021). As signs of inflation began to show in official government data, the Administration quickly shifted to a position that inflationary pressure was “transitory” and that it was to be “expect[ed] coming out of a big recession” (Chiacu, 2021). Most recently—following 9 consecutive months of inflation running well above its traditional target, wiping out all average wage gains for the year, and on pace to achieve the highest rate of any calendar year since 1981—the Administration endorsed the notion that inflation was a “high class” problem and simply a side effect of strong demand and low unemployment (Gillespie, 2021). The Administration began the year dismissing inflation concerns, shifted quickly to insistence that high inflation would pass quickly with little effect, and has now settled on a view that while high inflation may persist into 2022, it is a necessary consequence of their desired policy objectives.
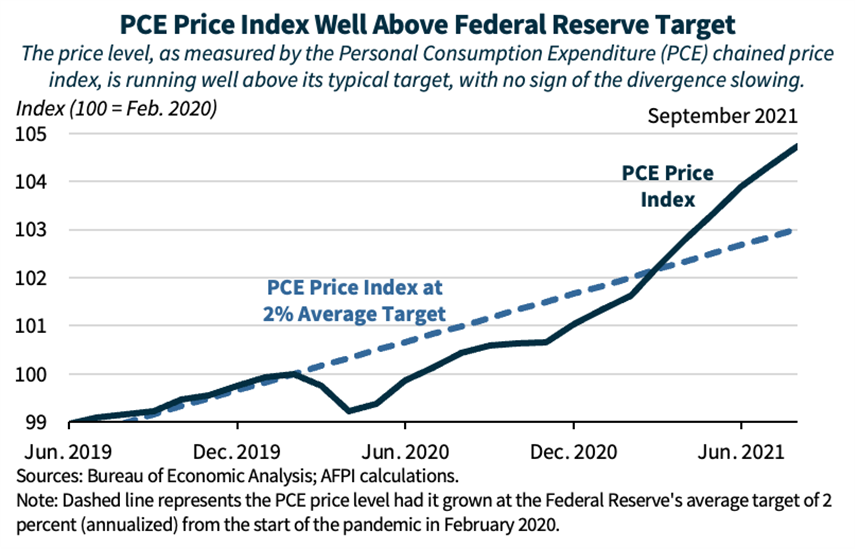
These comments and publicly-held views are also reflected in President Biden’s official budget proposal. Upon the release of the Fiscal Year 2022 budget request this past May, the Administration forecasted a year-over-year CPI inflation rate of just 2.1 percent for 2021 (OMB, 2021a). In the mid-session review—when the Administration revises their estimates based on the latest data available—the forecast of 2021 CPI inflation was revised up to 4.8 percent (OMB 2021b). This revised forecast will still likely fall short of the realized inflation rate given the pace over the last several months. As the Administration’s opinions and forecasts have shifted, the price level has continued to diverge further and further from the Federal Reserve’s usual average target. While some of this divergence may be by design—and in-line with relative price stability—as shown in the figure below, the divergence shows little signs of slowing (Adinarayan et al., 2021).
CONCLUSION
Heightened inflation in 2021 has come at a tremendous cost to American workers and families—particularly those in lower income brackets. While the Administration spins these costs and supply disruptions as a positive side effect of rising demand—after having dismissed and ignored them for much of the year—the real wage for the average worker has plummeted, and consumer prices are on pace to rise in 2021 at the highest rate in 4 decades (Flood, 2021). President Biden and his Administration’s failure to signal their understanding and knowledge of the costs of inflation, and the possible link between inflation and certain fiscal policies, is a sign that they remain disconnected from and unconcerned with the livelihood of American citizens. The Administration’s constantly evolving position and understanding of inflation gives little confidence that they will formulate appropriate fiscal policy moving forward. Policymakers must consider the effect of their policies on the costs Americans face, especially as inflation will likely remain a threat—and impose costs on families—over the next year.
WORKS CITED
Albanesi, S. (2007, May). “Inflation and inequality.” Journal of Monetary Economics, 54:4. https://www.sciencedirect.com/science/article/abs/pii/S0304393206002121
Bloomberg Markets and Finance. (2021, March 19). Larry Summers is worried above inflation [Video]. YouTube. https://www.youtube.com/watch?v=PBnaahSe7JU&t=4s
BLS (Bureau of Labor Statistics). (2021, October 13). Consumer Price Index News Release. https://www.bls.gov/news.release/cpi.htm
CBO (Congressional Budget Office). (2021, February). The Budget and Economic Outlook: 2021 to 2031. https://www.cbo.gov/system/files/2021-02/56970-Outlook.pdf
Chiacu, D. (2021, May 2). “U.S. Treasury’s Yellen tamps down inflation fears over Biden spending plan.” Reuters. https://www.reuters.com/business/us-treasurys-yellen-tamps-down-inflation-fears-over-biden-spending-plan-2021-05-02/
Crutsinger, M. (2021, March 8). “Yellen plays down inflation fears, pushes for relief bill.” Yahoo News. https://news.yahoo.com/yellen-plays-down-inflation-fears-152548256.html
Doepke, M. & M. Schneider. (2006). “Inflation and the Redistribution of Nominal Wealth.” Journal of Political Economy, 114:6. https://www.journals.uchicago.edu/doi/full/10.1086/508379
Dynan, K., J. Skinner, & S. Zeldes. (2000, December). “Do the Rich Save More?” Journal of Political Economy, 112:2. https://www.journals.uchicago.edu/doi/full/10.1086/381475
Erosa, A. & G. Ventura. (2002, May). “On inflation as a regressive consumption tax.” Journal of Monetary Economics, 49:4. https://www.sciencedirect.com/science/article/abs/pii/S0304393202001150
Eusepi, S. & B. Preston. (2018, September). “Fiscal Foundations of Inflation: Imperfect Knowledge.” American Economic Review, 108:9. https://www.aeaweb.org/articles?id=10.1257/aer.20131461
Federal Reserve Bank of Atlanta. (2021, October 27). GDPNow. https://www.atlantafed.org/cqer/research/gdpnow
Flood, B. (2021, October 15). “Biden official who said inflation issues are ‘high class problems’ once ripped Trump admin for price increases.” Fox News. https://www.foxnews.com/media/biden-official-inflation-high-class-trump-price
Friedman, M. (1992). “Money Mischief: Episodes in Monetary History.” Harcourt Brace Jovanovich. https://miltonfriedman.hoover.org/objects/57555/money-mischief-episodes-in-monetary-history
Garriga, C., F. Kydland, & R. Sustek. (2017, October). “Mortgages and Monetary Policy.” The Review of Financial Studies, 30:10. https://academic.oup.com/rfs/article/30/10/3337/3857753
Gillespie, B. (2021, October 14). “Biden Chief of Staff Ron Klain demolished for endorsing tweet claiming inflation is 'high class' problem.” Fox News. https://www.foxnews.com/media/biden-chief-of-staff-ron-klain-demolished-endorsing-tweet-inflation-high-class-problem
Jaravel, X. (2018, December 4). “The Unequal Gains from Product Innovations: Evidence from the U.S. Retail Sector.” The Quarterly Journal of Economics, 134:2. https://academic.oup.com/qje/article-abstract/134/2/715/5230867?redirectedFrom=fulltext
Li, S., G. Tang, D. Yang, & S. Du. (2019, April 12). “Research on the Relationship between CPI and PPI Based on VEC Model.” Open Journal of Statistics, 9. https://file.scirp.org/pdf/OJS_2019041116261924.pdf
NFIB (National Federation of Independent Business). (2021, September). Small Business Economic Trends. https://assets.nfib.com/nfibcom/SBET-Sept-2021.pdf
OMB (Office of Management and Budget). (2021a, May). Budget of the U.S. Government. https://www.whitehouse.gov/wp-content/uploads/2021/05/budget_fy22.pdf
OMB (Office of Management and Budget). (2021b, August). Mid-Session Review: Budget of the U.S. Government. https://www.whitehouse.gov/wp-content/uploads/2021/08/msr_fy22.pdf
Salviati, C., I. Popov, R. Warnock, L. Szini. (2021, September 27). “Apartment List National Rent Report.” Apartment List. https://www.apartmentlist.com/research/national-rent-data
Schanzenbach, D., R. Nunn, L. Bauer, & M. Mumford. (2016). “Where Does All the Money Go: Shifts in Household Spending Over the Past 30 Years.” The Hamilton Project. https://www.brookings.edu/wp-content/uploads/2016/08/where_does_all_the_money_go.pdf
Tankersley, J. (2021, October 26). “Rising Prices, Once Seen as Temporary, Threaten Biden’s Agenda.” The New York Times. https://www.nytimes.com/2021/10/26/business/economy/biden-inflation.html?referringSource=articleShare